How to Evaluate Prediction Market Liquidity Before You Trade
A practical guide to checking depth, spreads, and fill quality before you commit capital. Stop getting worse prices than you expected.
TL;DR: The price you see on a prediction market isn't always the price you get. Before you trade, check the bid-ask spread, order book depth, and recent volume. This guide shows you exactly what to look for — and how to avoid the most common execution mistakes.
We've written about how surface prices can mislead traders. This guide is the practical follow-up: a step-by-step approach to evaluating liquidity before you commit real money to a trade.
If you've ever placed a trade and gotten a worse price than you expected, or tried to sell a position and couldn't get out without taking a hit — that was a liquidity problem. Here's how to avoid it.
What Liquidity Actually Means
Liquidity is simpler than it sounds: can you buy the shares you want near the quoted price without moving the market against yourself? On a liquid contract, you buy 10,000 shares at 55¢ and the price barely moves. On a thin one, you buy 100 at 55¢, the next 100 cost 57¢, and your "55-cent position" averaged 58 cents. That gap is the cost of illiquidity, and it comes directly out of your returns.
Liquidity varies by platform, by market, by time of day, and by how close the market is to resolution. Learning to evaluate it quickly is one of the most practical skills a prediction market trader can develop.
The Three Things to Check
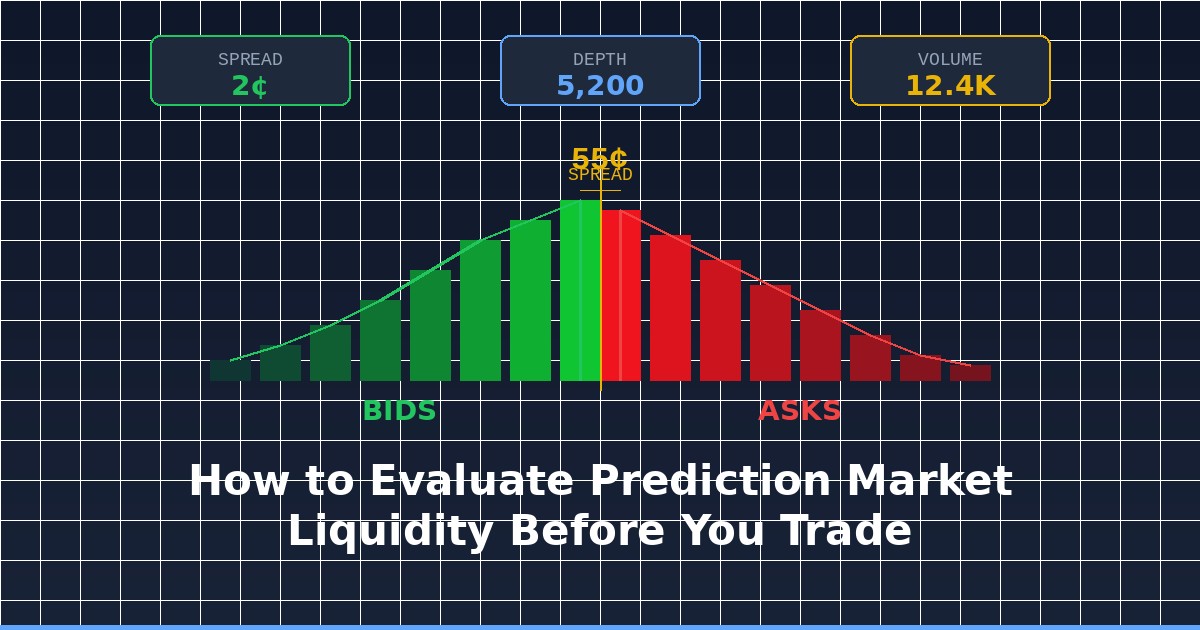
1. Bid-Ask Spread
The bid is the highest price someone is willing to pay to buy shares. The ask is the lowest price someone is willing to sell shares for. The gap between them is the spread — and it's the first and easiest indicator of liquidity.
| Spread | What It Tells You |
|---|---|
| 1-2¢ | Highly liquid. Market makers active. You'll get close to fair value on entry and exit. |
| 3-5¢ | Moderate liquidity. Expect some execution cost. Fine for most positions. |
| 6-10¢ | Thin. You're paying a meaningful premium to enter and giving up a lot to exit. Size carefully. |
| 10¢+ | Very illiquid. Unless you have a very strong thesis, the execution cost alone may eat your expected edge. |
Where to find it: On Kalshi, the order book shows bid and ask directly. On Polymarket, you can see the best available prices in the trading interface. Compare the gap.
Rule of thumb: If the spread is wider than your expected edge, the trade probably isn't worth it. If you think a contract should be at 60¢ and it's offered at 58¢, but the spread is 6 cents wide, your effective round-trip cost (in and out) could eat most of that 2-cent edge.
2. Order Book Depth
The spread tells you the cost of the first share. Depth tells you the cost of all the shares you want.
Depth is the number of shares available at each price level. A market might show an ask of 55¢, but if there are only 50 shares available at that price, and the next 200 shares are at 57¢, and the next 500 are at 60¢ — the price you actually pay depends entirely on how many shares you're trying to buy.
What to check:
- How many shares are available at the best ask? If it's less than your intended position size, you will experience slippage.
- How much does the price move if you double your order size? This tells you the market's sensitivity to your trade.
- Is depth symmetrical? If there are 5,000 shares on the buy side and only 200 on the sell side, the market can move sharply in one direction. This matters for your exit as much as your entry.
Practical example:
You want to buy 1,000 shares of "Yes" on a contract.
| Price Level | Shares Available | Cumulative | Your Average Price |
|---|---|---|---|
| 55¢ | 300 | 300 | 55.0¢ |
| 56¢ | 400 | 700 | 55.6¢ |
| 57¢ | 300 | 1,000 | 56.0¢ |
The "price" is 55¢. Your actual cost for 1,000 shares is 56.0¢. That's a full cent of slippage — not terrible, but it matters. On an illiquid market, the same exercise might show 3-5 cents of slippage.
3. Volume and Activity
Spread and depth are snapshots — they tell you what the order book looks like right now. Volume tells you how active the market is over time.
What to check:
- Daily volume: How many shares traded in the last 24 hours? A market that trades 100,000 shares daily will generally offer better execution than one that trades 500.
- Trade frequency: Are trades happening every few seconds, every few minutes, or every few hours? Infrequent trades mean the order book may not reflect current sentiment — prices could be stale.
- Volume trend: Is activity increasing or decreasing? Markets approaching resolution typically see volume spike. Markets in a quiet period might have deceptive spreads — the prices look tight, but there's no one actively trading.
Platform-Specific Considerations
Kalshi
Kalshi provides a visible order book with bid/ask prices and depth at each level. You can see exactly how many contracts are available before you trade. The platform also shows recent trade history, which gives you a sense of how actively the market is trading.
For Kalshi, pay attention to the order book during market hours. Spreads can widen significantly during off-peak hours (overnight, weekends) when market makers reduce their quotes. If you're placing a large order, consider using limit orders rather than market orders to control your execution price.
Polymarket
Polymarket shows best bid/ask and allows you to preview your execution price before confirming a trade. The preview is critical — it will show you the actual average price including slippage for your specific order size.
Polymarket uses a central limit order book (CLOB), but liquidity on individual contracts can vary widely. Small orders typically get excellent execution, but larger orders can experience more slippage than the surface price suggests — especially on thinner markets. Always use the execution preview.
Liquidity snapshots are point-in-time — always check before placing a trade, not just when you first open an account.
Common Mistakes
Mistake 1: Using Market Orders on Thin Markets
A market order says "fill me at whatever price is available." On a liquid market, that's fine — you'll get filled at or near the displayed price. On a thin market, a market order can fill across multiple price levels and cost you significantly more than expected.
Fix: Use limit orders. Set the maximum price you're willing to pay. If the market can't fill your order at that price, it will partially fill or not fill at all — which is better than overpaying.
Mistake 2: Ignoring Exit Liquidity
You found a great entry at 45¢ on a contract you think should be 60¢. Great. But when it's time to sell, will there be anyone to sell to?
Before entering a position, check the bid side of the order book, not just the ask. If there's thin depth on the buy side, you may struggle to exit at a fair price — especially if the market hasn't moved as much as you expected and you need to sell at a loss.
Fix: Size your position relative to the exit liquidity, not just the entry liquidity. If the bid side only has 200 shares at any given price level, a 5,000 share position is going to be expensive to unwind.
Mistake 3: Trading Immediately After Market Opens
New markets often launch with minimal liquidity. The first few hours of a new contract can have wide spreads, thin depth, and volatile pricing as the market finds its level. Unless you have a very strong conviction and are willing to accept execution risk, waiting for the market to develop usually gets you a better price.
Fix: Watch new markets for a few hours before trading. Let the initial price discovery happen. The spread will tighten and depth will build as market makers and traders arrive.
Mistake 4: Assuming Cross-Platform Prices Are Comparable
A contract at 55¢ on Kalshi and 55¢ on Polymarket isn't necessarily the same price in practice. If Kalshi has 10,000 shares at 55¢ and Polymarket has 100, the effective price for any meaningful position size could be significantly different. When you're comparing prices across platforms, compare the price you'd actually get for your intended position size — not just the displayed quote.
A Quick Liquidity Checklist
Before every trade, run through this:
- Spread: Is it tight enough that execution cost doesn't eat my edge?
- Depth at my size: Can the market fill my order without significant slippage?
- Exit liquidity: Is the bid side deep enough for me to get out when I want to?
- Volume: Is this market actively trading, or is the order book stale?
- Platform comparison: Am I getting the best effective price across platforms?
If any of these are red flags, either reduce your position size, use a limit order, or find a better market.
Why This Matters More Than Most Traders Think
Here's the math that makes liquidity evaluation essential:
Imagine you make 200 trades over a year, averaging 200 shares per trade. On each trade, poor liquidity evaluation costs you 2 cents per share in slippage — either on entry, exit, or both. That's $4 per trade (200 shares × 2¢), or $800 per year in unnecessary execution costs. For a trader with a $5,000 bankroll, that's 16% of your capital lost to something entirely avoidable.
Good liquidity evaluation isn't exciting. It won't find you the next big winning trade. But it's the difference between a strategy that compounds and one that bleeds out slowly through execution costs.
Start with the checklist. Use Prediction Hunt to compare prices across platforms. And remember: the price on the screen is an invitation, not a guarantee.
Frequently Asked Questions
What is liquidity in prediction markets?
Liquidity measures how easily you can buy or sell shares at a price close to the displayed quote, in the quantity you want, without significantly moving the market price. High liquidity means tight spreads, deep order books, and active trading. Low liquidity means wide spreads, thin depth, and the risk of getting a worse price than expected.
How do I check liquidity before placing a trade?
Check three things: the bid-ask spread (the gap between the best buy and sell prices — tighter is better), the depth at each price level (how many shares are available before the price moves), and recent trading volume (how actively the market is trading). All major platforms display this information in their trading interfaces.
What is a good bid-ask spread for prediction markets?
On highly liquid markets (major political events, popular sports), spreads of 1-2 cents are common and indicate excellent execution conditions. Spreads of 3-5 cents are moderate and acceptable for most trades. Spreads above 5-6 cents indicate thin liquidity where execution costs become a significant factor in your profitability.
Why did I get a worse price than what was displayed?
This is slippage — the difference between the displayed price and the price you actually paid. It happens when your order size exceeds the number of shares available at the best price. The remaining shares fill at progressively worse price levels. To avoid slippage, use limit orders instead of market orders and check order book depth before trading.
This article is for informational purposes only and does not constitute investment or financial advice.
Build with this data
Automate your strategies, create arb bots, or build your own dashboard. Free tier includes 1,000 requests/mo across all prediction market platforms.
Free Trading Tools
View allCompare fees across Kalshi, Polymarket & PredictIt.
Find fair probabilities with the overround removed.
See if a trade has positive EV before you enter.
Convert American, decimal & implied probability.
Combined odds and payouts for multi-leg bets.
Your real take-home after fees and taxes.
Related Posts
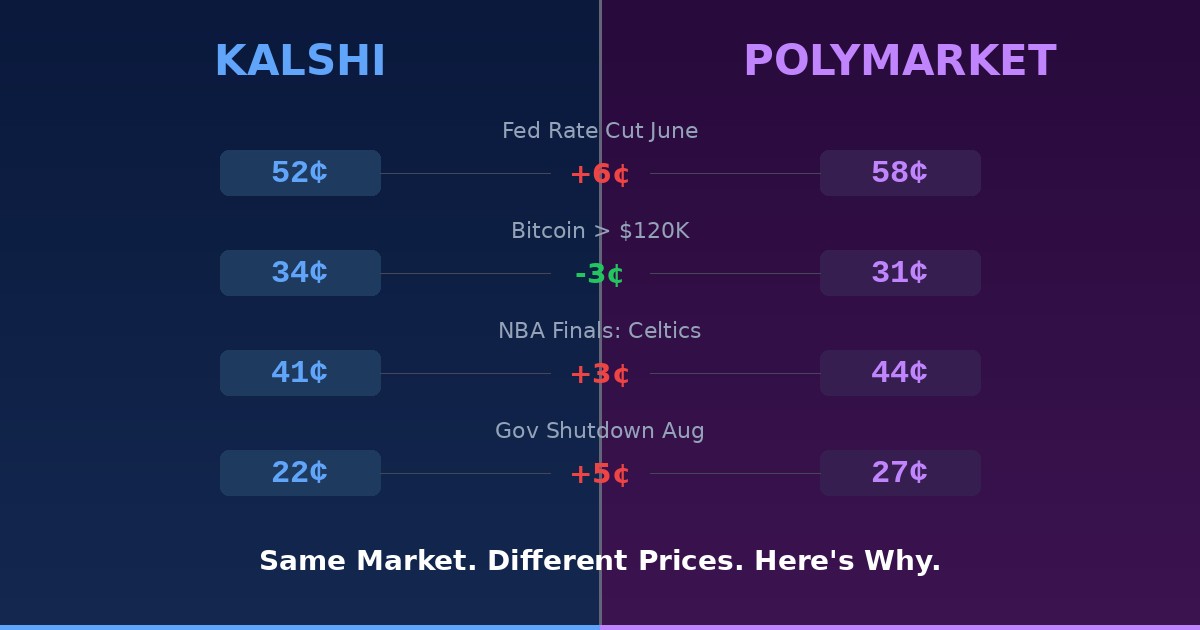
Why the Same Market Has Different Prices on Kalshi vs Polymarket
The same question can trade at 52¢ on one platform and 58¢ on another. It's not a glitch — it's liquidity, demographics, fees, and market structure. Here's what drives the gap.
7 min readRead
How to Build a Prediction Market Trading Bot: A Practical API Guide
A technical walkthrough of the APIs, SDKs, strategies, and hard-earned lessons behind building automated trading systems for prediction markets — from your first API call to a working bot.
11 min readRead
Position Sizing in Prediction Markets: The Kelly Criterion Guide
The Kelly Criterion, fractional Kelly, correlation risk, and why most prediction market traders blow up not because they're wrong — but because they bet too much when they're right.
13 min readRead